.png)
2017 Full Year Earnings
2017 FULL-YEAR EARNINGS February 8, 2018

2017 FULL-YEAR EARNINGS — FEBRUARY 8, 2018 DISCLAIMER This document was prepared by Klépierre solely for use of presenting the Klépierre 2017 full-year earnings published on February 7, 2018. This document is not to be reproduced nor distributed, in whole or in part, by any person other than the Company. The Companytakesno responsibility for the use of these materialsby any person. The information contained in this document has not been subject to independent verification and no representation, warranty or undertaking, express or implied, is made as to, and no reliance may be placed on, the fairness, accuracy, completeness or correctness of the information or opinions contained herein. Neither the Company nor its shareholders, its advisors, its representatives or any other person shall be held liable for any loss arising from any use of this document or its contents or otherwise arising in connection with this document. In the event of any discrepancies between the information contained in this document and the public documents, the latter shall prevail. This document does not constitute an offer to sell or an invitation or solicitation of an offer to subscribe for or purchase any securities, and this shall not form the basis for or be used for any such offer or invitation or other contract or engagementin any jurisdiction. 2
2017 FULL-YEAR EARNINGS — FEBRUARY 8, 2018 TABLE OF CONTENTS 01 02 03 2017 A PAN-EUROPEAN OPERATIONAL HIGHLIGHTS PLATFORM EXCELLENCE TAILORED FOR SUCCESS 04 05 FINANCIAL OUTLOOK DISCIPLINE 3
2017 FULL-YEAR EARNINGS — FEBRUARY 8, 2018 SHOP. MEET. CONNECT.TM 4

2017 FULL-YEAR EARNINGS — FEBRUARY 8, 2018 01 2017 HIGHLIGHTS 5
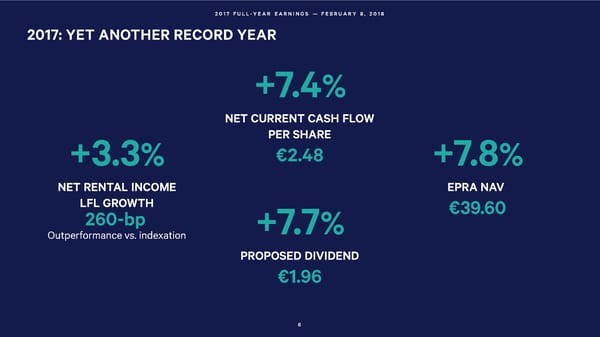
2017 FULL-YEAR EARNINGS — FEBRUARY 8, 2018 2017: YET ANOTHER RECORD YEAR +7.4% NET CURRENT CASH FLOW PER SHARE +3.3% €2.48 +7.8% NET RENTAL INCOME EPRA NAV LFLGROWTH €39.60 260-bp +7.7% Outperformance vs. indexation PROPOSED DIVIDEND €1.96 6
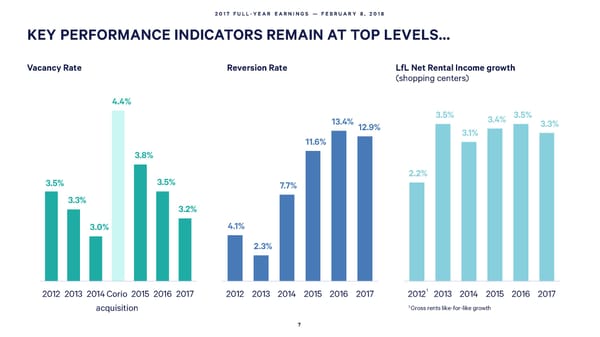
2017 FULL-YEAR EARNINGS — FEBRUARY 8, 2018 KEY PERFORMANCE INDICATORS REMAIN AT TOP LEVELS… Vacancy Rate Reversion Rate LfL Net Rental Income growth (shopping centers) 4.4% 13.4% 3.5% 3.4% 3.5% 12.9% 3.3% 3.1% 11.6% 3.8% 2.2% 3.5% 3.5% 7.7% 3.3% 3.2% 3.0% 4.1% 2.3% 2012 2013 2014Corio 2015 2016 2017 2012 2013 2014 2015 2016 2017 20121 2013 2014 2015 2016 2017 acquisition 1 Gross rents like-for-like growth 7
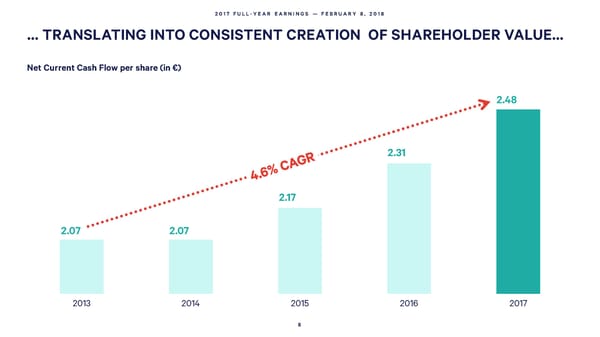
2017 FULL-YEAR EARNINGS — FEBRUARY 8, 2018 … TRANSLATING INTO CONSISTENT CREATION OF SHAREHOLDER VALUE… Net Current Cash Flow per share (in €) 2.48 2.31 2.17 2.07 2.07 2013 2014 2015 2016 2017 8
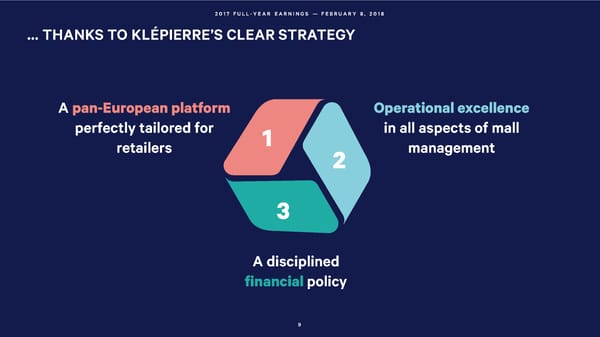
2017 FULL-YEAR EARNINGS — FEBRUARY 8, 2018 … THANKS TO KLÉPIERRE’SCLEAR STRATEGY A pan-European platform Operational excellence perfectly tailored for 1 in all aspects of mall retailers 2 management 3 A disciplined financialpolicy 9
2017 FULL-YEAR EARNINGS — FEBRUARY 8, 2018 02 A PAN-EUROPEAN PLATFORM TAILORED FOR SUCCESS 10
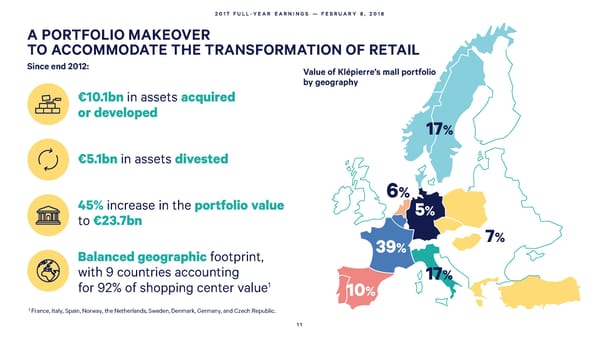
2017 FULL-YEAR EARNINGS — FEBRUARY 8, 2018 A PORTFOLIO MAKEOVER TO ACCOMMODATE THE TRANSFORMATION OF RETAIL Since end 2012: Value of Klépierre’s mall portfolio by geography €10.1bn in assets acquired or developed 17% €5.1bn in assets divested 45%increase in the portfolio value 6% to €23.7bn 5% 39% 7% Balanced geographic footprint, with 9 countries accounting 17% for 92% of shopping center value1 10% 1 France, Italy, Spain, Norway, the Netherlands, Sweden, Denmark, Germany, and Czech Republic. 11
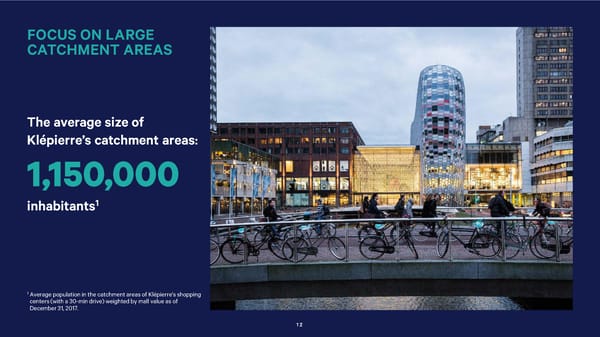
2017 FULL-YEAR EARNINGS — FEBRUARY 8, 2018 FOCUS ON LARGE CATCHMENT AREAS The average size of Klépierre’s catchment areas: 1,150,000 inhabitants1 1 Average population in the catchment areas of Klépierre’s shopping centers (with a 30-min drive) weighted by mall value as of December 31, 2017. 12
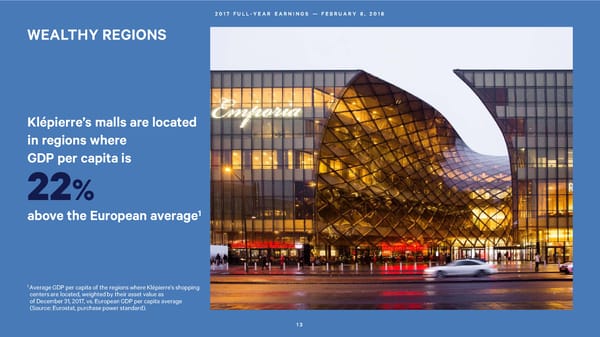
2017 FULL-YEAR EARNINGS — FEBRUARY 8, 2018 WEALTHY REGIONS Klépierre’s malls are located in regions where GDP per capita is 22% 1 above the European average 1 Average GDP per capita of the regions where Klépierre’s shopping centers are located, weighted by their asset value as of December 31, 2017, vs. European GDP per capita average (Source: Eurostat, purchase power standard). 13
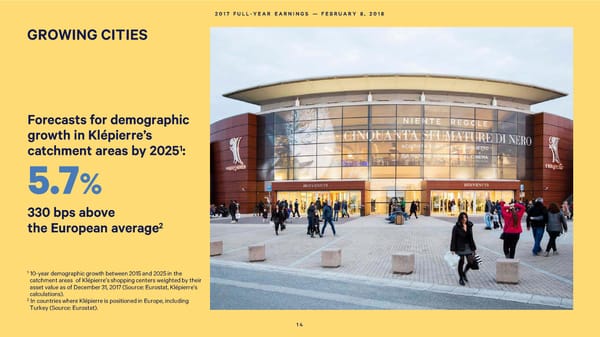
2017 FULL-YEAR EARNINGS — FEBRUARY 8, 2018 GROWING CITIES Forecasts for demographic growth in Klépierre’s catchment areas by 20251: 5.7% 330 bps above 2 the European average 1 10-year demographic growth between 2015 and 2025 in the catchment areas of Klépierre’s shopping centers weighted by their asset value as of December 31, 2017 (Source: Eurostat, Klépierre’s calculations). 2 In countries where Klépierre is positioned in Europe, including Turkey (Source: Eurostat). 14
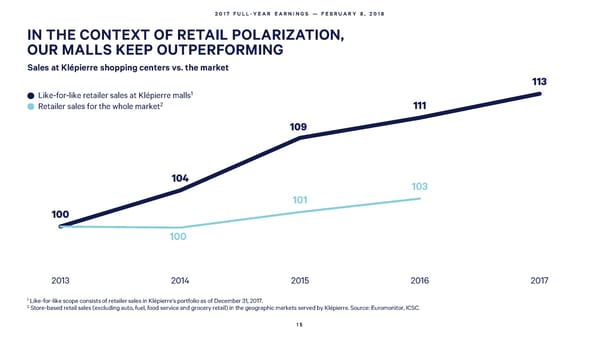
2017 FULL-YEAR EARNINGS — FEBRUARY 8, 2018 IN THE CONTEXT OF RETAIL POLARIZATION, OUR MALLS KEEP OUTPERFORMING Sales at Klépierre shopping centers vs. the market 113 Like-for-like retailer sales at Klépierre malls1 2 Retailer sales for the whole market 111 109 104 103 101 100 100 2013 2014 2015 2016 2017 1 Like-for-like scope consists of retailer sales in Klépierre’s portfolio as of December 31, 2017. 2 Store-based retail sales (excluding auto, fuel, food service and grocery retail) in the geographic markets served by Klépierre. Source: Euromonitor, ICSC. 15
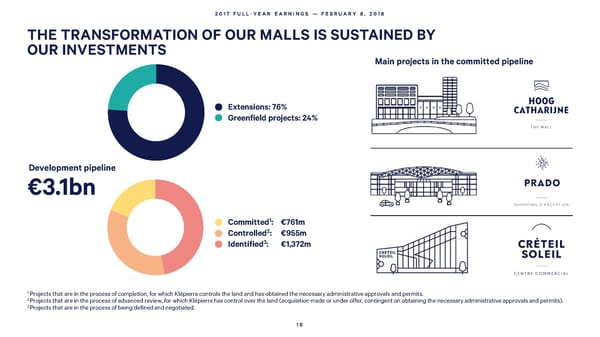
2017 FULL-YEAR EARNINGS — FEBRUARY 8, 2018 THE TRANSFORMATION OF OUR MALLS IS SUSTAINED BY OUR INVESTMENTS Main projects in the committed pipeline Extensions: 76% Greenfield projects: 24% Development pipeline €3.1bn 1 Committed: €761m 2 Controlled : €955m Identified3: €1,372m 1 Projects that are in the process of completion, for which Klépierrecontrols the land and has obtained the necessary administrative approvals and permits. 2Projects that are in the process of advanced review, for which Klépierrehas control over the land (acquisition made or under offer, contingent on obtaining the necessary administrative approvals and permits). 3Projects that are in the process of being defined and negotiated. 16
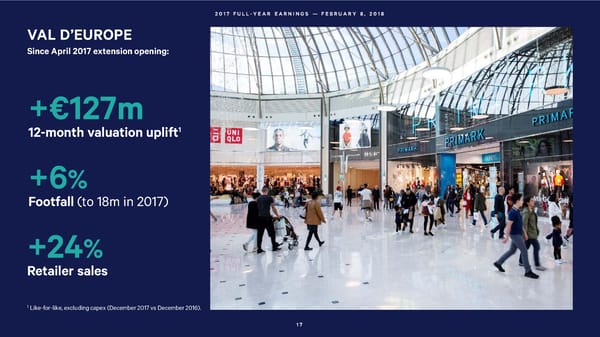
2017 FULL-YEAR EARNINGS — FEBRUARY 8, 2018 VAL D’EUROPE Since April 2017 extension opening: +€127m 12-month valuation uplift1 +6% Footfall (to 18m in 2017) +24% Retailer sales 1 Like-for-like, excluding capex (December 2017 vs December 2016). 17
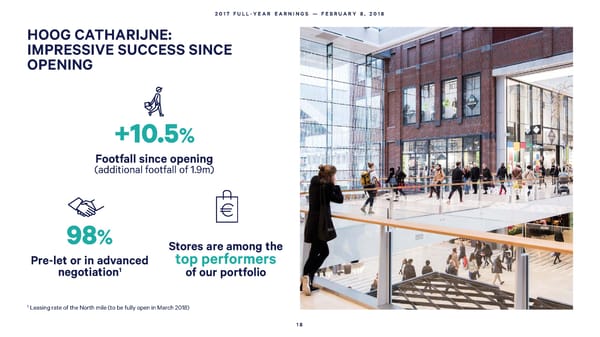
2017 FULL-YEAR EARNINGS — FEBRUARY 8, 2018 HOOGCATHARIJNE: IMPRESSIVE SUCCESS SINCE OPENING +10.5% Footfall since opening (additional footfall of 1.9m) 98% Stores are among the Pre-let or in advanced top performers 1 negotiation of our portfolio 1 Leasing rate of the North mile (to be fully open in March 2018) 18
PRADO: ANUNPRECEDENTED MALL FOR MARSEILLE IN TERMS OF DESIGN…

…LOCATION…
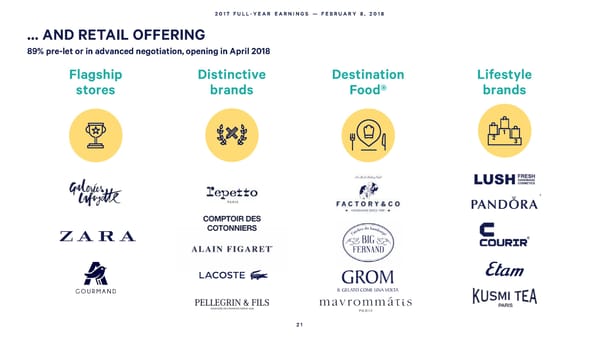
2017 FULL-YEAR EARNINGS — FEBRUARY 8, 2018 … AND RETAIL OFFERING 89% pre-let or in advanced negotiation, opening in April 2018 Flagship Distinctive Destination Lifestyle stores brands Food® brands 21
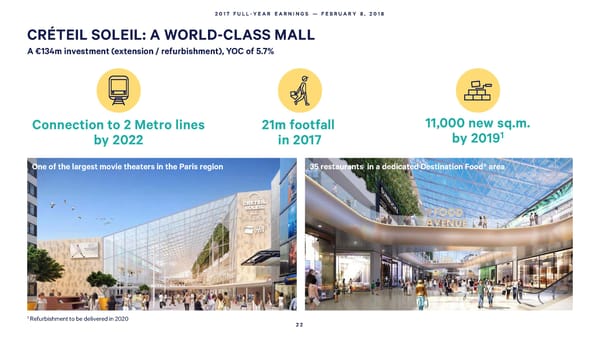
2017 FULL-YEAR EARNINGS — FEBRUARY 8, 2018 CRÉTEILSOLEIL: A WORLD-CLASS MALL A €134m investment (extension / refurbishment), YOC of 5.7% Connection to 2 Metro lines 21m footfall 11,000 new sq.m. 1 by 2022 in 2017 by 2019 One of the largest movie theaters in the Paris region 35 restaurants in a dedicated Destination Food® area 1 Refurbishment to be delivered in 2020 22
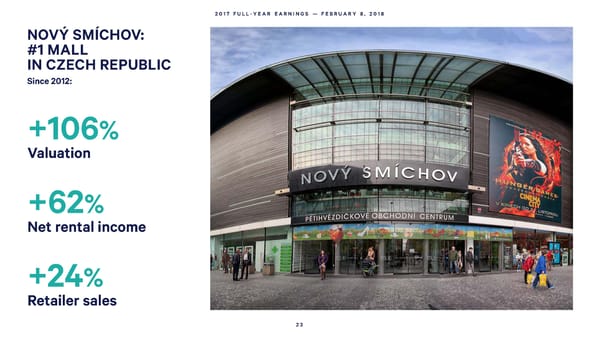
2017 FULL-YEAR EARNINGS — FEBRUARY 8, 2018 NOVÝ SMÍCHOV: #1 MALL IN CZECH REPUBLIC Since 2012: +106% Valuation +62% Net rental income +24% Retailer sales 23
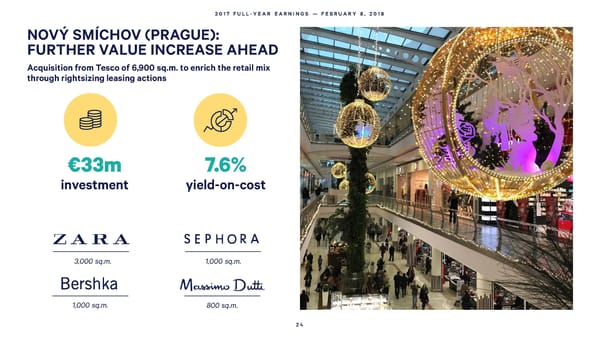
2017 FULL-YEAR EARNINGS — FEBRUARY 8, 2018 NOVÝ SMÍCHOV (PRAGUE): FURTHER VALUE INCREASE AHEAD Acquisition from Tesco of 6,900 sq.m. to enrich the retail mix through rightsizing leasing actions €33m 7.6% investment yield-on-cost 3,000 sq.m. 1,000 sq.m. 1,000 sq.m. 800 sq.m. 24
2017 FULL-YEAR EARNINGS — FEBRUARY 8, 2018 03 OPERATIONAL EXCELLENCE 25
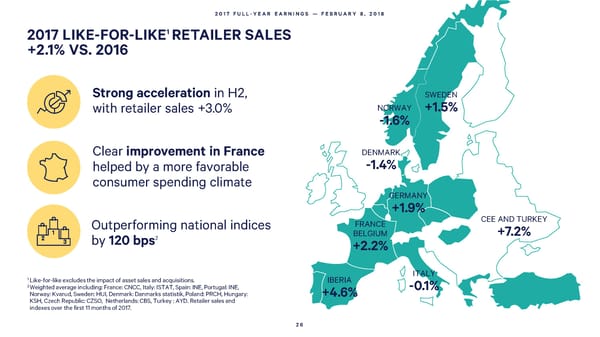
2017 FULL-YEAR EARNINGS — FEBRUARY 8, 2018 2017 LIKE-FOR-LIKE1RETAILER SALES +2.1% VS. 2016 Strong acceleration in H2, SWEDEN with retailer sales +3.0% NORWAY +1.5% -1.6% Clear improvement in France DENMARK helped by a more favorable -1.4% consumer spending climate GERMANY +1.9% Outperforming national indices FRANCE CEE AND TURKEY by 120 bps2 BELGIUM +7.2% +2.2% ITALY 1 Like-for-like excludes the impact of asset sales and acquisitions. IBERIA 2Weighted average including: France: CNCC, Italy: ISTAT, Spain: INE, Portugal: INE, -0.1% Norway: Kvarud, Sweden: HUI, Denmark: Danmarksstatistik, Poland: PRCH, Hungary: +4.6% KSH, Czech Republic: CZSO, Netherlands: CBS, Turkey : AYD. Retailer sales and indexes over the first 11 months of 2017. 26
2017 FULL-YEAR EARNINGS — FEBRUARY 8, 2018 NET RENTAL INCOME +3.3% LIKE-FOR-LIKE, OUTPERFORMING INDEXATION BY 260 BPS Net Rental Income like-for-like1growth NRIlike-for-like growth1 3.5% 2017 vs. 2016 3.4% 3.3% France-Belgium 2.5% 3.1% Italy 2.9% +3.0% Scandinavia 4.6% Iberia 6.8% CEE and Turkey 3.1% The Netherlands 2.1% Germany 0.1% Total shopping centers 3.3% 2014 2015 2016 2017 1 Like-for-like excludes the contribution of new spaces (acquisitions, new centers, and extensions), spaces being restructured, disposals completed since January 2016, and foreign exchange impacts. 27
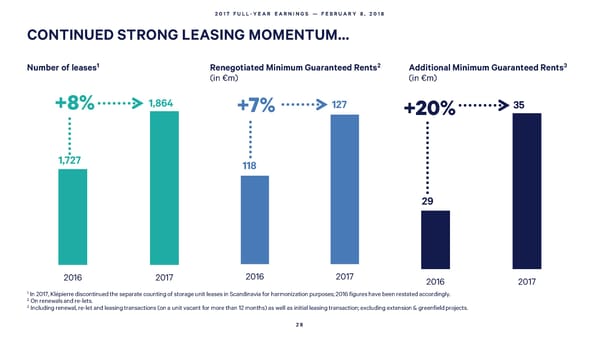
2017 FULL-YEAR EARNINGS — FEBRUARY 8, 2018 CONTINUED STRONG LEASING MOMENTUM… 1 2 3 Number of leases Renegotiated Minimum Guaranteed Rents Additional Minimum Guaranteed Rents (in €m) (in €m) +8% 1,864 +7% 127 +20% 35 1,727 118 29 2016 2017 2016 2017 2016 2017 1 In 2017, Klépierre discontinued the separate counting of storage unit leases in Scandinavia for harmonization purposes; 2016 figures have been restated accordingly. 2 On renewals and re-lets. 3 Including renewal, re-let and leasing transactions (on a unit vacant for more than 12 months) as well as initial leasing transaction; excluding extension & greenfield projects. 28
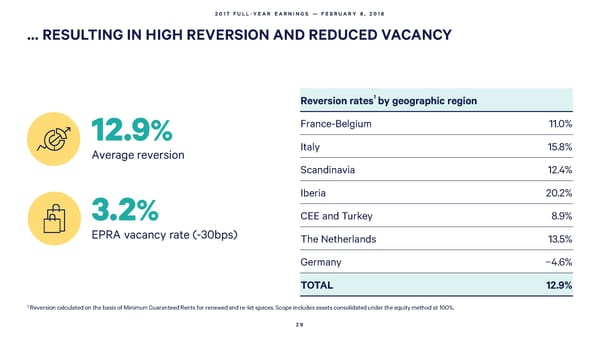
2017 FULL-YEAR EARNINGS — FEBRUARY 8, 2018 … RESULTING IN HIGH REVERSION AND REDUCED VACANCY Reversionrates1by geographicregion 12.9% France-Belgium 11.0% Average reversion Italy 15.8% Scandinavia 12.4% Iberia 20.2% 3.2% CEE and Turkey 8.9% EPRAvacancy rate (-30bps) The Netherlands 13.5% Germany −4.6% TOTAL 12.9% 1 Reversion calculated on the basis of Minimum Guaranteed Rents for renewed and re-let spaces. Scope includes assets consolidated under the equity method at 100%. 29
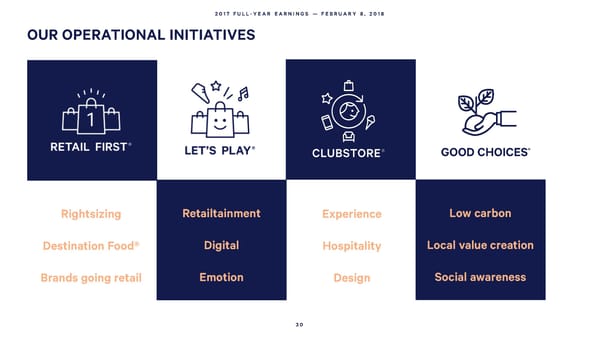
2017 FULL-YEAR EARNINGS — FEBRUARY 8, 2018 OUR OPERATIONAL INITIATIVES ® GOOD CHOICES Rightsizing Retailtainment Experience Low carbon Destination Food® Digital Hospitality Local value creation Brands going retail Emotion Design Social awareness 30
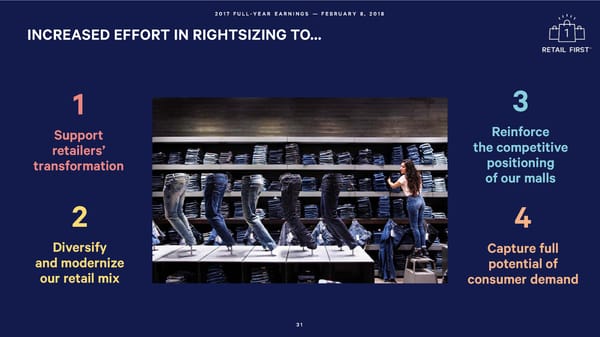
2017 FULL-YEAR EARNINGS — FEBRUARY 8, 2018 INCREASED EFFORT IN RIGHTSIZING TO… 1 3 Support Reinforce retailers’ the competitive transformation positioning of our malls 2 4 Diversify Capture full and modernize potential of our retail mix consumer demand 31
2017 FULL-YEAR EARNINGS — FEBRUARY 8, 2018 LEVERAGING THE EXPANSION OF TRENDY RETAILERS THROUGHOUT EUROPE Number of stores signed or opened over the past 2 years1 Pandora 22 JD Sports 17 Zara 16 Flying Tiger 14 NYX 12 Stradivarius 10 Bershka 9 Guess 8 Parfois 8 Lush 8 Skechers 8 Pull & Bear 5 Nespresso 5 1 New store and new concept implementation. 32
2017 FULL-YEAR EARNINGS — FEBRUARY 8, 2018 DESTINATION FOOD® ROLL-OUT Since 2013, Food & Beverages retailers sales have grown almost twice as fast as the rest of the group Recent implementation of Destination Food® Food & beverage sales vs. total retailer sales1 120 Food & beverage retailer sales Total retailer sales 116 111 111 108 109 Ongoing Destination Food® implementation 105 104 100 100 2013 2014 2015 2016 2017 1 Like-for-like excludes the impact of asset sales and acquisitions. 33
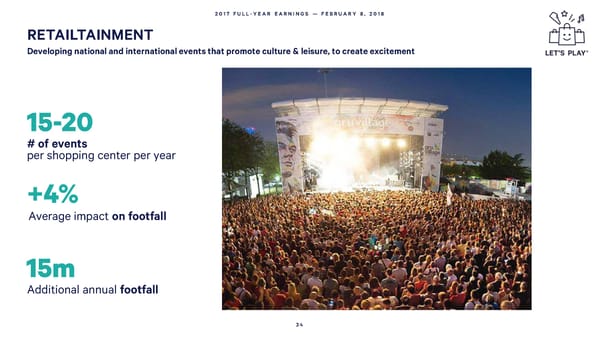
2017 FULL-YEAR EARNINGS — FEBRUARY 8, 2018 RETAILTAINMENT Developing national and international events that promote culture & leisure, to create excitement 15-20 # of events per shopping center per year +4% Average impact on footfall 15m Additional annual footfall 34
2017 FULL-YEAR EARNINGS — FEBRUARY 8, 2018 ENGAGING OUR CUSTOMERS THROUGH DIGITAL 3.8m Facebook fans +17% vs. 2016 Engagement rate on social media 340bps above average1 In-depth social media listening with Critizr to get the most of customers’ insights More than 40malls answering customers questions in less than 1 hour (#JustAsk) 1 Engagement rate (number of interactions through click, like, share, comments) on Klépierre malls’ Facebook pages at 4.0% compared to 0.61% (worldwide average for accounts with a fan base of between 10,000 and 99,999) 35

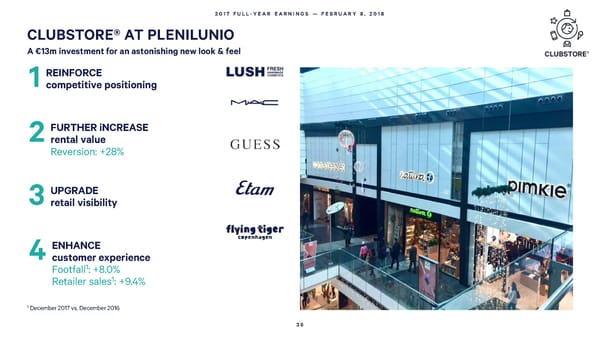
2017 FULL-YEAR EARNINGS — FEBRUARY 8, 2018 CLUBSTORE® AT PLENILUNIO A €13m investment for an astonishing new look & feel 1REINFORCE competitive positioning 2FURTHER iNCREASE rental value Reversion: +28% 3UPGRADE retail visibility 4ENHANCE customer experience 1: +8.0% Footfall Retailer sales1: +9.4% 1 December 2017 vs. December 2016 36
BLAGNAC(TOULOUSE, FRANCE): €15M INVESTMENT FOR 2020
OSLO CITY (NORWAY): €15M INVESTMENT FOR 2020
2017 FULL-YEAR EARNINGS — FEBRUARY 8, 2018 AN EVEN MORE AMBITIOUS CSR STRATEGY TO SUPPORT THE BUSINESS AND PROMOTE SUSTAINABLE PERFORMANCE 39
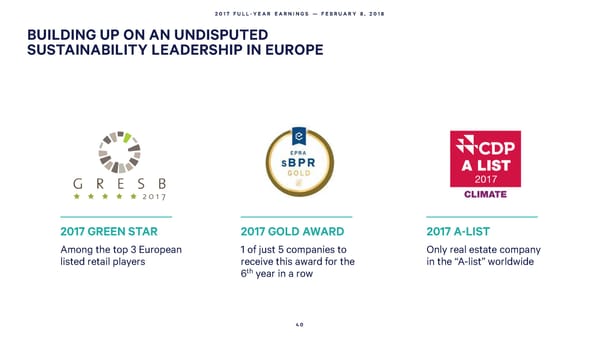
2017 FULL-YEAR EARNINGS — FEBRUARY 8, 2018 BUILDING UP ON AN UNDISPUTED SUSTAINABILITY LEADERSHIP IN EUROPE 2017 GREEN STAR 2017 GOLD AWARD 2017 A-LIST Among the top 3 European 1 of just 5 companies to Only real estate company listed retail players receive this award for the in the “A-list” worldwide th year in a row 6 40
2017 FULL-YEAR EARNINGS — FEBRUARY 8, 2018 ACT FOR GOOD®: A MORE COMPREHENSIVE, 3-TIER APPROACH Supported by a 5-year action plan and an ambition for 2030 ACT FOR THE PLANET Developing a portfolio of shopping centers that generate environmental benefits ACT FOR TERRITORIES Designing and operating our centers as “local hubs” that stimulate value creation ACT FOR PEOPLE Empowering our communities in a sustainable way 41
2017 FULL-YEAR EARNINGS — FEBRUARY 8, 2018 4 EXAMPLES OF OUR 13 AMBITIOUS COMMITMENTS FOR THE NEXT 5 YEARS TO ACT FOR GOOD® Working Develop Contribute to Offer a for a low-carbon a fully-certified local employment positive future portfolio around our centers employee experience −40% 100% 100% 100% in energy of our assets and local service training access rate consumption development suppliers for the for our staff (vs. base year 2013) projects daily operations of our centers 42
2017 FULL-YEAR EARNINGS — FEBRUARY 8, 2018 04 DISCIPLINED FINANCIAL POLICY 43
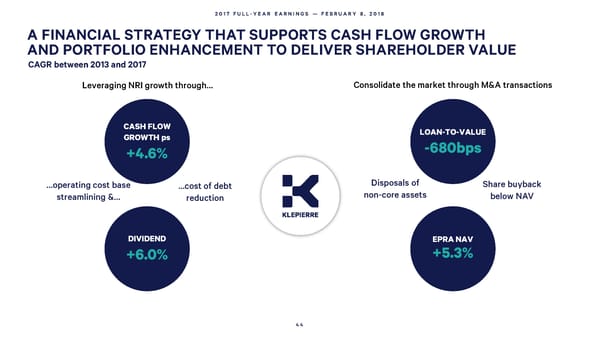
2017 FULL-YEAR EARNINGS — FEBRUARY 8, 2018 A FINANCIAL STRATEGY THAT SUPPORTS CASH FLOW GROWTH AND PORTFOLIO ENHANCEMENT TO DELIVER SHAREHOLDER VALUE CAGRbetween 2013 and 2017 Leveraging NRIgrowth through… Consolidate the market through M&A transactions CASH FLOW LOAN-TO-VALUE GROWTH ps -680bps +4.6% …operating cost base …cost of debt Disposals of Share buyback streamlining &… reduction non-core assets below NAV DIVIDEND EPRANAV +6.0% +5.3% 44
2017 FULL-YEAR EARNINGS — FEBRUARY 8, 2018 2017: MULTIPLE DRIVERS TO GENERATE 7.4% INCREASE IN CASH FLOW PER SHARE Net Rental Operating Net Current Cash Income € Cash Flow € Flow per share +2.1% +2.8% +7.4% • Net rental income • Savings in G&A • Further decrease boosted by strong (-€6m) of the cost of debt like-for-like growth • Reflects Corio synergies (1.8%) (+3.3%) and constant focus on • Accretive impact • More than offsetting streamlining costs of the share buyback the impact of the reduced impact 45
2017 FULL-YEAR EARNINGS — FEBRUARY 8, 2018 FOCUS ON STREAMLINING COSTS Reduction in G&Acosts (in €m) Cost of debt & Interest Coverage Ratio General expenses ICR Payroll Cost of debt In % of Net Rental Income 25.00% 6.3x 24.00% 80 23.00% 3.5% 5.2x 66 65 22.00% 3.0% 4.5X 49 52 21.00% 3.6x 2.5% 20.3% 149 20.00% 3.0x 2.1% 131 1.8% 122 109 125 19.00% 17.1% 18.00% 17. 00% 16.00% 15.00% 2013 2014 2015 2016 2017 2013 2014 2015 2016 2017 46
2017 FULL-YEAR EARNINGS — FEBRUARY 8, 2018 OPTIMIZED DEBT POSITION, BETTER HEDGED AGAINST INTEREST RATE FLUCTUATIONS Projected cost of debt Portfolio value, net debt & Loan-to-Value ratio according to various interest rate fluctuation scenarios1 Currentyieldcurve(as of 12/31/17) Portfolio value (in €m, total share, excl. transfer taxes) Currentyieldcurve+100 bps Net debt(in €m) Currentyieldcurve+200 bps LTV 2.1 25,000 39.3% , 39.2% , 1.9 20,000 1.8 , 1.9 15,000 1.8 1.8 , 36.8% 36.8% 1.8 10,000 1.7 1.7 1.7 , 5,000 0 2017 2018 2019 2020 2014 2015 2016 2017 If interest rates were to increase by 200 bps, Klépierre’s cost of debt would rise by only 35 bps by 2020 (vs 2017)1 1 Assuming the Group’s debt and average credit spreads remain stable until 2020 and considering the interest-rate curve of the currencies used by the Group (EUR, NOK, SEK & DKK) at December 31, 2017. Includes the €700 m caps portfolio implemented in January 2018. 47
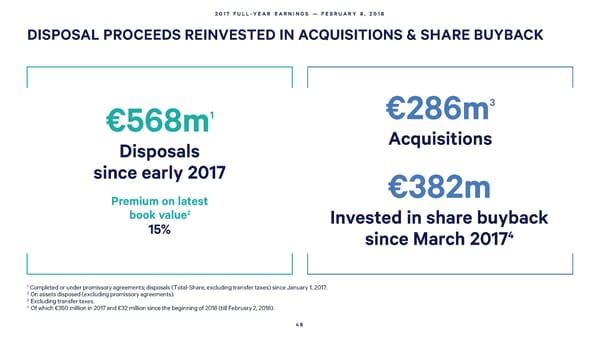
2017 FULL-YEAR EARNINGS — FEBRUARY 8, 2018 DISPOSAL PROCEEDS REINVESTED IN ACQUISITIONS & SHARE BUYBACK 3 €568m1 €286m Disposals Acquisitions since early 2017 €382m Premium on latest 2 book value Invested in share buyback 15% 4 since March 2017 1 Completed or under promissory agreements; disposals (Total-Share, excluding transfer taxes) since January 1, 2017. 2 On assets disposed (excluding promissory agreements). 3 Excluding transfer taxes. 4 Of which €350 million in 2017 and €32 million since the beginning of 2018 (till February 2, 2018). 48
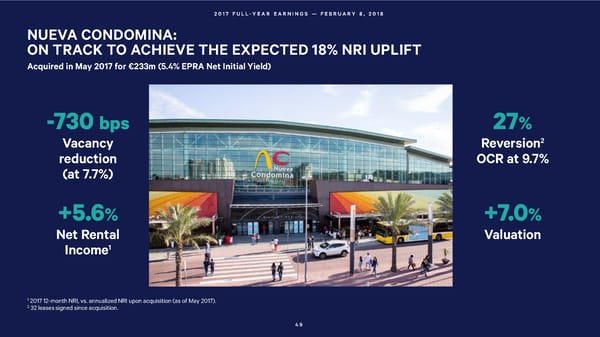
22001177 FFULLULL--YYEEAAR ER EAARNIRNINGNGSS —— FFEEBBRRUAUARRY Y 88,, 22001188 NUEVA CONDOMINA: ON TRACK TO ACHIEVE THE EXPECTED 18% NRIUPLIFT Acquired in May 2017 for €233m (5.4% EPRA Net Initial Yield) -730 bps 27% Vacancy Reversion2 reduction OCR at 9.7% (at 7.7%) +5.6% +7.0% Net Rental Valuation 1 Income 1 2017 12-month NRI, vs. annualized NRI upon acquisition (as of May 2017). 2 32 leases signed since acquisition. 4949
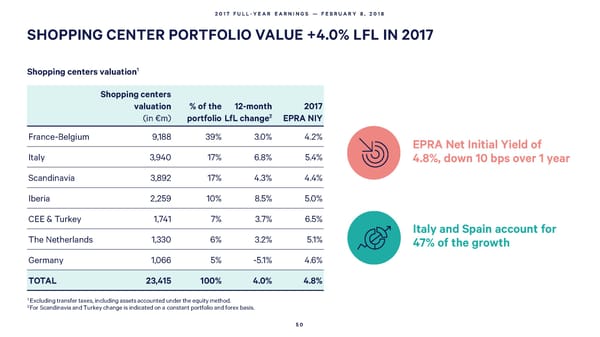
2017 FULL-YEAR EARNINGS — FEBRUARY 8, 2018 SHOPPING CENTER PORTFOLIO VALUE +4.0% LFL IN 2017 Shopping centers valuation1 Shopping centers valuation % of the 12-month 2017 2 (in €m) portfolio LfL change EPRANIY France-Belgium 9,188 39% 3.0% 4.2% EPRANet Initial Yield of Italy 3,940 17% 6.8% 5.4% 4.8%, down 10 bps over 1 year Scandinavia 3,892 17% 4.3% 4.4% Iberia 2,259 10% 8.5% 5.0% CEE & Turkey 1,741 7% 3.7% 6.5% Italy and Spain account for The Netherlands 1,330 6% 3.2% 5.1% 47% of the growth Germany 1,066 5% -5.1% 4.6% TOTAL 23,415 100% 4.0% 4.8% 1 Excluding transfer taxes, including assets accounted under the equity method. 2For Scandinavia and Turkey change is indicated on a constant portfolio and forex basis. 50
2017 FULL-YEAR EARNINGS — FEBRUARY 8, 2018 EPRA NAV OF €39.60, +7.8% YEAR-ON-YEAR (in € per share) 12/31/2016 06/30/2017 12/31/2017 12-monthchange EPRA NAV 36.70 37.00 39.60 7.8% EPRA NNNAV 35.20 35.30 37.60 6.9% 12-month change in EPRA NAV per share +2.4 39.60 +2.5 -0.2 36.70 -1.8 12/31/2016 Dividend Cash flow Like-for-like asset Forex and others 12/31/2017 311,827,6111 revaluation 302,099,3751 1 Number of shares end of period (excl. treasury shares). 51
2017 FULL-YEAR EARNINGS — FEBRUARY 8, 2018 PROPOSED 2017 DIVIDEND: €1.96 PER SHARE, +7.7% Dividend evolution (in € per share) 6.0% CAGR 1.962 0.68 1.82 1.70 1.43 0.50 1.28 1.55 1.60 0.93 1.20 0.62 0.39 2013 2014 2015 2016 2017 77% 79% 81% 79% 81% PAYOUT1 SIIC Non-SIIC Proposed dividend: €1.962per share (€0.68 SIIC), to be paid on April 30, 2018 (ex-date: April 26, 2018) 1 Dividend per share x number of shares (including treasury shares) / Net current cash flow (Group-Share). 2Submitted to a vote of the shareholders at their April 24, 2018 Annual General Meeting. 52
2017 FULL-YEAR EARNINGS — FEBRUARY 8, 2018 05 OUTLOOK 53
2017 FULL-YEAR EARNINGS — FEBRUARY 8, 2018 2018 GUIDANCE Net current cash flow per share €2.57 – €2.62 Assuming stable or lower net debt 54

2017 FULL-YEAR EARNINGS — FEBRUARY 8, 2018 AGENDA April 24, 2018 AnnualGeneral Meeting April 26, 2018 Dividend ex-date April 30, 2018 Dividend payment April 26, 2018 st quarter business review1 2018 1 1 Press release after market close. 55
2017 FULL-YEAR EARNINGS — FEBRUARY 8, 2018 06 APPENDICES 56
2017 FULL-YEAR EARNINGS — FEBRUARY 8, 2018 2017 OPERATING HIGHLIGHTS RETAILER SALES NET RENTALINCOME LEASING INDICATORS LfL Change1 2017 Reversion OCR EPRA Vacancy LfLChange1 LfL Change (%) (%) rate (%) excl. extensions Current (€M) France-Belgium +2.2% +0.7% +6.8 +2.5% +11.0% 12.7% 3.3% France +2.4% +0.9% +5.7 +2.3% 3.5% Belgium -1.6% -1.6% +1.2 +7.5% 0.2% Italy -0.1% -0.1% +5.3 +2.9% +15.8% 11.5% 1.2% Scandinavia -0.4% -0.4% -7.7 +4.6% +12.4% 11.5% 3.1% Norway -1.6% -1.6% -1.0 +4.3% 2.2% Sweden +1.5% +1.5% -5.5 +4.7% 3.7% Denmark -1.4% -1.4% -1.2 +4.7% 4.0% Netherlands - - +3.8 +2.1% +13.5% - 6.0% Iberia +4.6% +4.6% +11.6 +6.8% +20.2% 13.1% 4.2% Spain +4.5% +4.5% +10.2 +6.6% 3.1% Portugal +4.7% +4.7% +1.4 +7.3% 7.6% Germany +1.9% +1.9% +0.9 +0.1% -4.6% 10.9% 5.9% CEE and Turkey +7.2% +7.2% +3.7 +3.1% +8.9% 12.9% 3.9% Poland +4.3% +4.3% -0.6 -1.9% 1.1% Hungary +10.9% +10.9% +2.0 +14.7% 2.4% Czech Republic +5.2% +5.2% +3.6 +12.9% 1.2% Turkey +9.8% +9.8% -1.5 -6.9% 7.3% TOTAL SHOPPING CENTERS +2.1% +1.3% +24.4 +3.3% +12.9% 12.2% 3.2% 1 Like-for-like excludes the impact of asset sales. Retailer sales from the Dutch portfolio are not included in these numbers as retailers do not report sales to Klépierre. 57
2017 FULL-YEAR EARNINGS — FEBRUARY 8, 2018 PROFIT & LOSS(€M) TOTAL SHARE GROUP SHARE €M 12/31/2017 12/31/2016 12/31/2017 12/31/2016 Gross rental income 1,236.0 1,214.0 1,064.1 1,045.4 Rental & building expenses -130.4 -130.6 -109.3 -111.9 NET RENTALINCOME 1,105.6 1,083.4 954.8 933.4 Management, administrative and related income 85.6 86.5 81.5 82.2 Other operating revenue 10.5 18.4 8.5 16.6 Survey & research costs -1.0 -2.8 -1.0 -2.8 Payroll expenses -124.9 -131.4 -118.1 -124.1 Other general expenses -63.6 -63.4 -60.0 -59.6 EBITDA 1,012.2 990.6 865.7 845.8 Depreciations and impairment allowance on investment property -15.2 -14.8 -14.1 -13.4 Provisions -0.6 -5.2 -0.3 -5.3 Proceeds of sales 6.8 23.5 2.1 7.8 Goodwill depreciation -1.7 - -1.7 - Change in value of investment property 825.9 828.8 678.2 646.6 OPERATING INCOME 1,827.5 1,822.8 1,529.8 1,481.4 Net cost of debt -169.8 -197.7 -155.8 -180.7 Change in the fair value of financial instruments -15.1 -12.1 -14.4 -12.1 Share in earnings of equity method investees 74.4 89.5 64.3 84.5 PROFIT BEFORE TAXES 1,717.0 1,702.6 1,424.0 1,373.0 Taxdue -18.3 -29.0 -15.9 -26.3 Deferred taxes -201.0 -196.6 -179.5 -155.5 NETINCOME 1,497.8 1,476.9 1,228.6 1,191.2 58
2017 FULL-YEAR EARNINGS — FEBRUARY 8, 2018 CASH FLOW STATEMENT (€M) TOTAL SHARE GROUP SHARE 12/31/2017 12/31/2016 12/31/2017 12/31/2016 GROSS RENTAL INCOME 1,236.0 1,214.0 1,064.1 1,045.4 Rental & building expenses -130.4 -130.6 -109.3 -111.9 NET RENTAL INCOME 1,105.6 1,083.4 954.8 933.4 Management and other income 96.1 104.8 90.0 98.8 Restatement deferred incomes -0.7 -7.2 -0.7 -7.2 G&A expenses -189.5 -197.6 -179.2 -186.5 Restatement payroll and deferred expenses 15.1 15.5 15.0 15.2 Net cost of debt -169.8 -197.7 -155.8 -180.8 Restatement financial allowance & financial restructuring 14.1 16.1 14.1 16.1 Share in earnings of equity method investees 51.5 61.0 48.5 55.9 Current tax expenses -29.2 -26.6 -26.2 -23.9 NET CURRENT CASH FLOW 893.4 851.6 760.6 721.1 Restatement payroll and deferred expenses -13.8 -7.9 Restatement amortization allowances and provisions for contingencies and losses -14.4 -18.8 EPRA EARNINGS 732.4 694.4 Per share NET CURRENT CASH FLOW PER SHARE 2.48 2.31 EPRA EARNINGS PER SHARE 2.39 2.23 Averagenumberof sharesexcludingtreasuryshares. 306,084,849 311,736,861 59
2017 FULL-YEAR EARNINGS — FEBRUARY 8, 2018 VALUATION OF THE PORTFOLIO (€M, TOTAL SHARE, EXCL. TRANSFER TAXES) 12/31/2017 % of total portfolio 12/31/2016 12-month change 12-month change Current Like-for-like1 France 8,757 36.8% 8,420 +4.0% +2.6% Belgium 432 1.8% 385 +12.1% +11.2% France-Belgium 9,188 38.7% 8,805 +4.4% +3.0% Italy 3,940 16.6% 3,707 +6.3% +6.8% Norway 1,459 6.1% 1,595 -8.5% +4.5% Sweden 1,295 5.4% 1,316 -1.6% +4.8% Denmark 1,138 4.8% 1,097 +3.7% +3.6% Scandinavia 3,892 16.4% 4,008 -2.9% +4.3% Spain 1,870 7.9% 1,485 +25.9% +7.8% Portugal 389 1.6% 346 +12.3% +11.4% Iberia 2,259 9.5% 1,831 +23.4% +8.5% Poland 403 1.7% 423 -4.8% -5.2% Hungary 248 1.0% 227 +9.4% +12.9% Czech Republic 622 2.6% 509 +22.3% +16.6% Turkey 440 1.8% 563 -21.9% -5.2% CEE & Turkey 1,741 7.3% 1,757 -1.0% +3.7% The Netherlands 1,330 5.6% 1,234 +7.8% +3.2% Germany 1,066 4.5% 1,074 -0.8% -5.1% TOTAL SHOPPING CENTERS 23,415 98.5% 22,418 +4.4% +4.0% Other Retail Properties 355 1.5% 399 -10.9% -2.5% TOTAL 23,770 100.0% 22,817 +4.2% +3.9% 1 Excludes the impact of new centers opened, acquisitions, asset sales completed since January 1, 2017, extension capex and foreign exchange impacts. 60
2017 FULL-YEAR EARNINGS — FEBRUARY 8, 2018 VALUATION OF THE PORTFOLIO (€M, GROUP SHARE, EXCL. TRANSFER TAXES) 12/31/2017 % of total portfolio 12/31/2016 12-month change 12-month change Current Like-for-like1 France 7,073 34.9% 6,880 +2.8% +1.9% Belgium 432 2.1% 385 +12.1% +11.2% France-Belgium 7,504 37.0% 7,265 +3.3% +2.4% Italy 3,900 19.3% 3,665 +6.4% +6.9% Norway 819 4.0% 895 -8.5% +4.5% Sweden 726 3.6% 738 -1.6% +4.8% Denmark 638 3.2% 616 +3.7% +3.6% Scandinavia 2,183 10.8% 2,249 -2.9% +4.3% Spain 1,870 9.2% 1,444 +29.4% +7.8% Portugal 389 1.9% 346 +12.3% +11.4% Iberia 2,258 11.1% 1,791 +26.1% +8.5% Poland 403 2.0% 423 -4.8% -5.2% Hungary 248 1.2% 227 +9.4% +12.9% Czech Republic 622 3.1% 509 +22.3% +16.6% Turkey 417 2.1% 540 -22.8% -5.5% CEE & Turkey 1,715 8.5% 1,732 -0.9% +3.8% Netherlands 1,330 6.6% 1,234 +7.8% +3.2% Germany 1,012 5.0% 1,021 -0.8% -5.1% TOTAL SHOPPING CENTERS 19,904 98.2% 18,956 +5.0% +3.9% Other Retail Properties 355 1.8% 399 -10.9% -2.5% TOTAL 20,259 100.0% 19,354 +4.7% +3.8% 1 Excludes the impact of new centers opened, acquisitions, asset sales completed since January 1, 2017 extension capex and foreign exchange impacts. 61
2017 FULL-YEAR EARNINGS — FEBRUARY 8, 2018 SHOPPING CENTER VALUATION (GROUP SHARE –EXCLUDING TRANSFER TAXES –IN €M) +716 20,380 20,259 +188 -121 19,354 +317 -196 12/31/2016 Disposals Non LFL LFL LFL 12/31/2017 Forex 12/31/2017 portfolio Capex Portfolio excl. Forex 62
2017 FULL-YEAR EARNINGS — FEBRUARY 8, 2018 DEVELOPMENT PIPELINE Klépierre Estimated Floor area Expected equity cost(a) Cost to date Targeted yield Development project City Type (sq.m.) opening date interest (€m) (€m) on cost(b) HoogCatharijnePhases 2 & 3 Utrecht extension-refurbishment 76,271 2017-2019 100.0% 438 276 6.4% Créteil Soleil - Phase 1 Paris region extension-refurbishment 11,147 2019-2020 80.0% 134 3 5.7% Other projects (incl. Prado) 29,444 188 160 6.5% TOTAL COMMITTED PROJECTS 116,862 761 438 6.3% Gran Reno Bologna extension 16,360 H2 2020 100.0% 129 15 Bègles Rives d'Arcins(TFE included) Bordeaux extension 25,080 H2 '18-H2 '20 52.0% 31 6 Grand Littoral Marseille redevelopment 12,000 H2 2020 100.0% 30 0 Lonato(c) Lombardy extension 15,000 H2 2020 50.0% 30 0 BarceloneMare Magnum 1 Barcelone extension 8,000 H2 2021 100.0% 45 0 L’esplanade Brussels region extension 19,475 H1 2021 100.0% 131 18 Grenoble Grand Place Grenoble extension 16,040 H2 2021 100.0% 55 0 Val d'Europe Paris region extension 10,620 H2 2021 55.0% 48 0 Grand Portet Toulouse region extension-refurbishment 8,000 H2 2021 83.0% 64 8 Turin Le Gru Turin extension 12,000 H2 2021 100.0% 80 0 Montpellier Odysseum Montpellier extension-refurbishment 11,750 H1 2022 100.0% 36 1 Økernsenteret(c) Oslo redevelopment 53,220 H2 2022 28.1% 86 6 Viva Odense new development 48,500 H2 2022 56.1% 186 24 TOTAL CONTROLLED PROJECTS 256,970 955 77 TOTAL IDENTIFIED PROJECTS 236,500 1,372 14 TOTAL 610,332 3,088 529 (a) Estimated cost as of December 31, 2017 including fitting-out (when applicable) and excluding step-up rents (when applicable), internal development fees, and financial costs. (b) Targeted yield on cost as of December 31, 2017, based on targeted NRI with full occupancy and excluding all lease incentives (when applicable), divided by the estimated cost price as defined above. (c) Assets consolidated under the equity method. For these projects, the estimated cost and cost to date are reported for Klépierre’s share of equity. Floor areas are the total area of the projects. 63