.png)
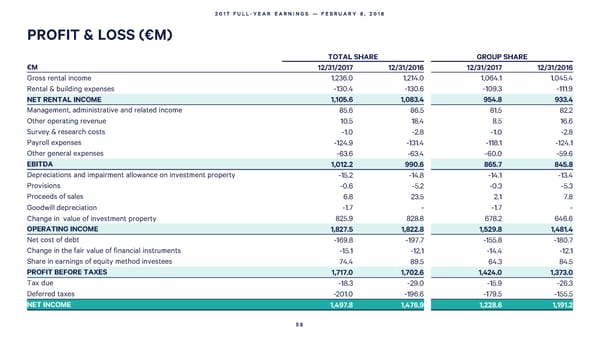
2017 FULL-YEAR EARNINGS — FEBRUARY 8, 2018 PROFIT & LOSS(€M) TOTAL SHARE GROUP SHARE €M 12/31/2017 12/31/2016 12/31/2017 12/31/2016 Gross rental income 1,236.0 1,214.0 1,064.1 1,045.4 Rental & building expenses -130.4 -130.6 -109.3 -111.9 NET RENTALINCOME 1,105.6 1,083.4 954.8 933.4 Management, administrative and related income 85.6 86.5 81.5 82.2 Other operating revenue 10.5 18.4 8.5 16.6 Survey & research costs -1.0 -2.8 -1.0 -2.8 Payroll expenses -124.9 -131.4 -118.1 -124.1 Other general expenses -63.6 -63.4 -60.0 -59.6 EBITDA 1,012.2 990.6 865.7 845.8 Depreciations and impairment allowance on investment property -15.2 -14.8 -14.1 -13.4 Provisions -0.6 -5.2 -0.3 -5.3 Proceeds of sales 6.8 23.5 2.1 7.8 Goodwill depreciation -1.7 - -1.7 - Change in value of investment property 825.9 828.8 678.2 646.6 OPERATING INCOME 1,827.5 1,822.8 1,529.8 1,481.4 Net cost of debt -169.8 -197.7 -155.8 -180.7 Change in the fair value of financial instruments -15.1 -12.1 -14.4 -12.1 Share in earnings of equity method investees 74.4 89.5 64.3 84.5 PROFIT BEFORE TAXES 1,717.0 1,702.6 1,424.0 1,373.0 Taxdue -18.3 -29.0 -15.9 -26.3 Deferred taxes -201.0 -196.6 -179.5 -155.5 NETINCOME 1,497.8 1,476.9 1,228.6 1,191.2 58
 2017 Full Year Earnings Page 57 Page 59