.png)
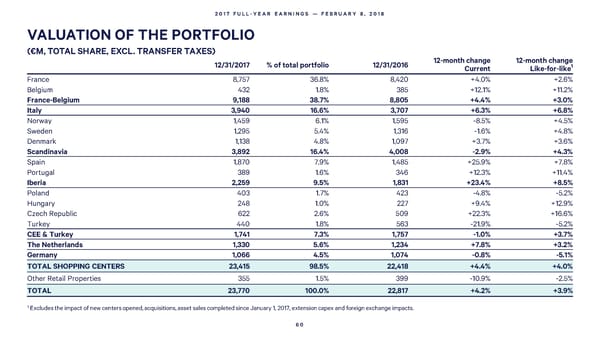
2017 FULL-YEAR EARNINGS — FEBRUARY 8, 2018 VALUATION OF THE PORTFOLIO (€M, TOTAL SHARE, EXCL. TRANSFER TAXES) 12/31/2017 % of total portfolio 12/31/2016 12-month change 12-month change Current Like-for-like1 France 8,757 36.8% 8,420 +4.0% +2.6% Belgium 432 1.8% 385 +12.1% +11.2% France-Belgium 9,188 38.7% 8,805 +4.4% +3.0% Italy 3,940 16.6% 3,707 +6.3% +6.8% Norway 1,459 6.1% 1,595 -8.5% +4.5% Sweden 1,295 5.4% 1,316 -1.6% +4.8% Denmark 1,138 4.8% 1,097 +3.7% +3.6% Scandinavia 3,892 16.4% 4,008 -2.9% +4.3% Spain 1,870 7.9% 1,485 +25.9% +7.8% Portugal 389 1.6% 346 +12.3% +11.4% Iberia 2,259 9.5% 1,831 +23.4% +8.5% Poland 403 1.7% 423 -4.8% -5.2% Hungary 248 1.0% 227 +9.4% +12.9% Czech Republic 622 2.6% 509 +22.3% +16.6% Turkey 440 1.8% 563 -21.9% -5.2% CEE & Turkey 1,741 7.3% 1,757 -1.0% +3.7% The Netherlands 1,330 5.6% 1,234 +7.8% +3.2% Germany 1,066 4.5% 1,074 -0.8% -5.1% TOTAL SHOPPING CENTERS 23,415 98.5% 22,418 +4.4% +4.0% Other Retail Properties 355 1.5% 399 -10.9% -2.5% TOTAL 23,770 100.0% 22,817 +4.2% +3.9% 1 Excludes the impact of new centers opened, acquisitions, asset sales completed since January 1, 2017, extension capex and foreign exchange impacts. 60
 2017 Full Year Earnings Page 59 Page 61