.png)
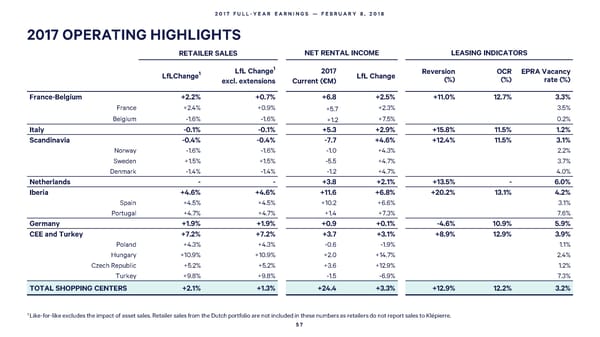
2017 FULL-YEAR EARNINGS — FEBRUARY 8, 2018 2017 OPERATING HIGHLIGHTS RETAILER SALES NET RENTALINCOME LEASING INDICATORS LfL Change1 2017 Reversion OCR EPRA Vacancy LfLChange1 LfL Change (%) (%) rate (%) excl. extensions Current (€M) France-Belgium +2.2% +0.7% +6.8 +2.5% +11.0% 12.7% 3.3% France +2.4% +0.9% +5.7 +2.3% 3.5% Belgium -1.6% -1.6% +1.2 +7.5% 0.2% Italy -0.1% -0.1% +5.3 +2.9% +15.8% 11.5% 1.2% Scandinavia -0.4% -0.4% -7.7 +4.6% +12.4% 11.5% 3.1% Norway -1.6% -1.6% -1.0 +4.3% 2.2% Sweden +1.5% +1.5% -5.5 +4.7% 3.7% Denmark -1.4% -1.4% -1.2 +4.7% 4.0% Netherlands - - +3.8 +2.1% +13.5% - 6.0% Iberia +4.6% +4.6% +11.6 +6.8% +20.2% 13.1% 4.2% Spain +4.5% +4.5% +10.2 +6.6% 3.1% Portugal +4.7% +4.7% +1.4 +7.3% 7.6% Germany +1.9% +1.9% +0.9 +0.1% -4.6% 10.9% 5.9% CEE and Turkey +7.2% +7.2% +3.7 +3.1% +8.9% 12.9% 3.9% Poland +4.3% +4.3% -0.6 -1.9% 1.1% Hungary +10.9% +10.9% +2.0 +14.7% 2.4% Czech Republic +5.2% +5.2% +3.6 +12.9% 1.2% Turkey +9.8% +9.8% -1.5 -6.9% 7.3% TOTAL SHOPPING CENTERS +2.1% +1.3% +24.4 +3.3% +12.9% 12.2% 3.2% 1 Like-for-like excludes the impact of asset sales. Retailer sales from the Dutch portfolio are not included in these numbers as retailers do not report sales to Klépierre. 57
 2017 Full Year Earnings Page 56 Page 58