.png)
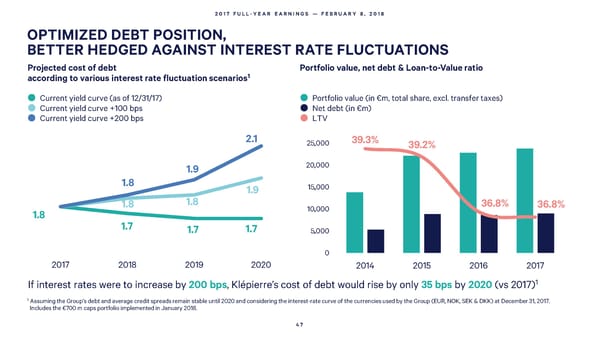
2017 FULL-YEAR EARNINGS — FEBRUARY 8, 2018 OPTIMIZED DEBT POSITION, BETTER HEDGED AGAINST INTEREST RATE FLUCTUATIONS Projected cost of debt Portfolio value, net debt & Loan-to-Value ratio according to various interest rate fluctuation scenarios1 Currentyieldcurve(as of 12/31/17) Portfolio value (in €m, total share, excl. transfer taxes) Currentyieldcurve+100 bps Net debt(in €m) Currentyieldcurve+200 bps LTV 2.1 25,000 39.3% , 39.2% , 1.9 20,000 1.8 , 1.9 15,000 1.8 1.8 , 36.8% 36.8% 1.8 10,000 1.7 1.7 1.7 , 5,000 0 2017 2018 2019 2020 2014 2015 2016 2017 If interest rates were to increase by 200 bps, Klépierre’s cost of debt would rise by only 35 bps by 2020 (vs 2017)1 1 Assuming the Group’s debt and average credit spreads remain stable until 2020 and considering the interest-rate curve of the currencies used by the Group (EUR, NOK, SEK & DKK) at December 31, 2017. Includes the €700 m caps portfolio implemented in January 2018. 47
 2017 Full Year Earnings Page 46 Page 48