.png)
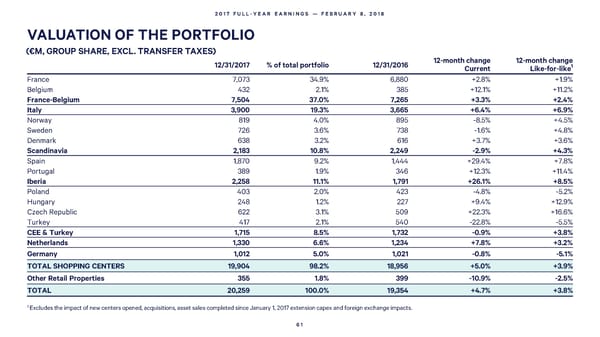
2017 FULL-YEAR EARNINGS — FEBRUARY 8, 2018 VALUATION OF THE PORTFOLIO (€M, GROUP SHARE, EXCL. TRANSFER TAXES) 12/31/2017 % of total portfolio 12/31/2016 12-month change 12-month change Current Like-for-like1 France 7,073 34.9% 6,880 +2.8% +1.9% Belgium 432 2.1% 385 +12.1% +11.2% France-Belgium 7,504 37.0% 7,265 +3.3% +2.4% Italy 3,900 19.3% 3,665 +6.4% +6.9% Norway 819 4.0% 895 -8.5% +4.5% Sweden 726 3.6% 738 -1.6% +4.8% Denmark 638 3.2% 616 +3.7% +3.6% Scandinavia 2,183 10.8% 2,249 -2.9% +4.3% Spain 1,870 9.2% 1,444 +29.4% +7.8% Portugal 389 1.9% 346 +12.3% +11.4% Iberia 2,258 11.1% 1,791 +26.1% +8.5% Poland 403 2.0% 423 -4.8% -5.2% Hungary 248 1.2% 227 +9.4% +12.9% Czech Republic 622 3.1% 509 +22.3% +16.6% Turkey 417 2.1% 540 -22.8% -5.5% CEE & Turkey 1,715 8.5% 1,732 -0.9% +3.8% Netherlands 1,330 6.6% 1,234 +7.8% +3.2% Germany 1,012 5.0% 1,021 -0.8% -5.1% TOTAL SHOPPING CENTERS 19,904 98.2% 18,956 +5.0% +3.9% Other Retail Properties 355 1.8% 399 -10.9% -2.5% TOTAL 20,259 100.0% 19,354 +4.7% +3.8% 1 Excludes the impact of new centers opened, acquisitions, asset sales completed since January 1, 2017 extension capex and foreign exchange impacts. 61
 2017 Full Year Earnings Page 60 Page 62