.png)
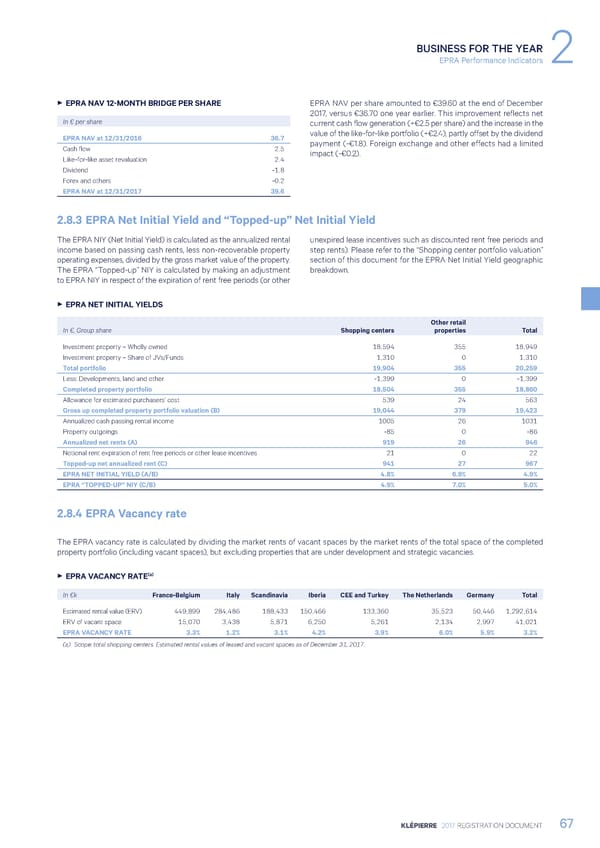
BUSINESS FOR THE YEAR EPRA Performance Indicators 2 3 EPRA NAV 12-MONTH BRIDGE PER SHARE EPRA NAV per share amounted to €39.60 at the end of December 2017, versus €36.70 one year earlier. This improvement reflects net In € per share current cash flow generation (+€2.5 per share) and the increase in the EPRA NAV at 12/31/2016 36.7 value of the like-for-like portfolio (+€2.4), partly offset by the dividend Cash flow 2.5 payment (-€1.8). Foreign exchange and other effects had a limited Like-for-like asset revaluation 2.4 impact (-€0.2). Dividend -1.8 Forex and others -0.2 EPRA NAV at 12/31/2017 39.6 2.8.3 EPRA Net Initial Yield and “Topped-up” Net Initial Yield The EPRA NIY (Net Initial Yield) is calculated as the annualized rental unexpired lease incentives such as discounted rent free periods and income based on passing cash rents, less non-recoverable property step rents). Please refer to the “Shopping center portfolio valuation” operating expenses, divided by the gross market value of the property. section of this document for the EPRA Net Initial Yield geographic The EPRA “Topped-up” NIY is calculated by making an adjustment breakdown. to EPRA NIY in respect of the expiration of rent free periods (or other 3 EPRA NET INITIAL YIELDS Other retail In €, Group share Shopping centers properties Total Investment property – Wholly owned 18,594 355 18,949 Investment property – Share of JVs/Funds 1,310 0 1,310 Total portfolio 19,904 355 20,259 Less: Developments, land and other -1,399 0 -1,399 Completed property portfolio 18,504 355 18,860 Allowance for estimated purchasers’ cost 539 24 563 Gross up completed property portfolio valuation (B) 19,044 379 19,423 Annualized cash passing rental income 1005 26 1031 Property outgoings -85 0 -86 Annualized net rents (A) 919 26 946 Notional rent expiration of rent free periods or other lease incentives 21 0 22 Topped-up net annualized rent (C) 941 27 967 EPRA NET INITIAL YIELD (A/B) 4.8% 6.9% 4.9% EPRA “TOPPED-UP” NIY (C/B) 4.9% 7.0% 5.0% 2.8.4 EPRA Vacancy rate The EPRA vacancy rate is calculated by dividing the market rents of vacant spaces by the market rents of the total space of the completed property portfolio (including vacant spaces), but excluding properties that are under development and strategic vacancies. 3 EPRA VACANCY RATE(a) In €k France-Belgium Italy Scandinavia Iberia CEE and Turkey The Netherlands Germany Total Estimated rental value (ERV) 449,899 284,486 188,433 150,466 133,360 35,523 50,446 1,292,614 ERV of vacant space 15,070 3,438 5,871 6,250 5,261 2,134 2,997 41,021 EPRA VACANCY RATE 3.3% 1.2% 3.1% 4.2% 3.9% 6.0% 5.9% 3.2% (a) Scope: total shopping centers. Estimated rental values of leased and vacant spaces as of December 31, 2017. KLÉPIERRE 2017 REGISTRATION DOCUMENT 67
 Registration Document 2017 Page 68 Page 70