.png)
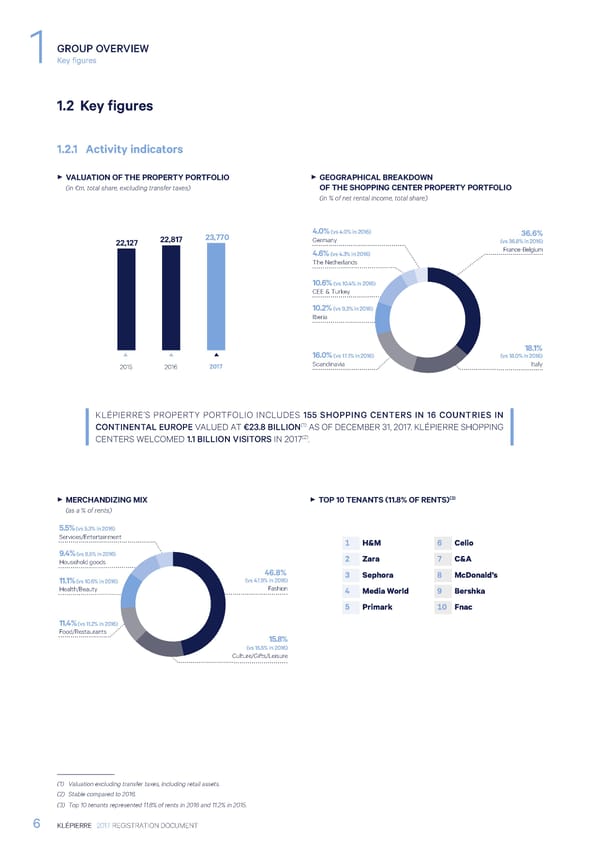
GROUP OVERVIEW 1 Key figures 1.2 Key figures 1.2.1 Activity indicators 3 VALUATION OF THE PROPERTY PORTFOLIO 3 GEOGRAPHICAL BREAKDOWN (in €m, total share, excluding transfer taxes) OF THE SHOPPING CENTER PROPERTY PORTFOLIO (in % of net rental income, total share) 23,770 4.0% (vs 4.0% in 2016) 36.6% 22,127 22,817 Germany (vs 36.8% in 2016) 4.6% (vs 4.3% in 2016) France-Belgium The Netherlands 10.6% (vs 10.4% in 2016) CEE & Turkey 10.2% (vs 9.3% in 2016) Iberia 16.0% (vs 17.1% in 2016) 18.1% (vs 18.0% in 2016) 2015 2016 2017 Scandinavia Italy KLÉPIERRE’S PROPERTY PORTFOLIO INCLUDES 155 SHOPPING CENTERS IN 16 COUNTRIES IN CONTINENTAL EUROPE VALUED AT €23.8 BILLION(1) AS OF DECEMBER 31, 2017. KLÉPIERRE SHOPPING CENTERS WELCOMED 1.1 BILLION VISITORS IN 2017(2). 3 MERCHANDIZING MIX 3 TOP 10 TENANTS (11.8% OF RENTS)(3) (as a % of rents) 5.5% (vs 5.3% in 2016) Services/Entertainment 1 H&M 6 Celio 9.4% (vs 9.5% in 2016) 2 Zara 7 C&A Household goods 46.8% 3 Sephora 8 McDonald’s 11.1% (vs 10.6% in 2016) (vs 47.9% in 2016) Health/Beauty Fashion 4 Media World 9 Bershka 5 Primark 10 Fnac 11.4% (vs 11.2% in 2016) Food/Restaurants 15.8% (vs 15.5% in 2016) Culture/Gifts/Leisure (1) Valuation excluding transfer taxes, including retail assets. (2) Stable compared to 2016. (3) Top 10 tenants represented 11.8% of rents in 2016 and 11.2% in 2015. 6 KLÉPIERRE 2017 REGISTRATION DOCUMENT
 Registration Document 2017 Page 7 Page 9