.png)
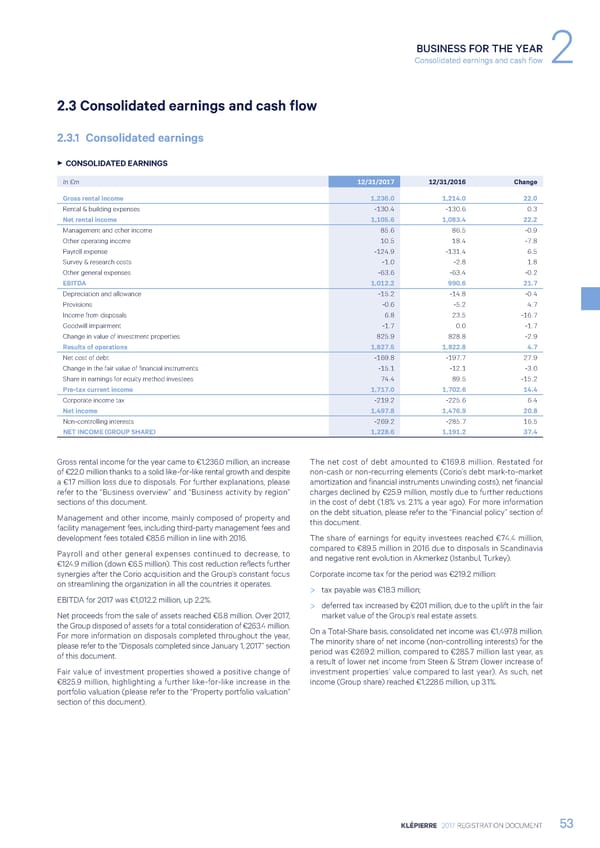
BUSINESS FOR THE YEAR Consolidated earnings and cash flow 2 2.3 Consolidated earnings and cash flow 2.3.1 Consolidated earnings 3 CONSOLIDATED EARNINGS In €m 12/31/2017 12/31/2016 Change Gross rental income 1,236.0 1,214.0 22.0 Rental & building expenses -130.4 -130.6 0.3 Net rental income 1,105.6 1,083.4 22.2 Management and other income 85.6 86.5 -0.9 Other operating income 10.5 18.4 -7.8 Payroll expense -124.9 -131.4 6.5 Survey & research costs -1.0 -2.8 1.8 Other general expenses -63.6 -63.4 -0.2 EBITDA 1,012.2 990.6 21.7 Depreciation and allowance -15.2 -14.8 -0.4 Provisions -0.6 -5.2 4.7 Income from disposals 6.8 23.5 -16.7 Goodwill impairment -1.7 0.0 -1.7 Change in value of investment properties 825.9 828.8 -2.9 Results of operations 1,827.5 1,822.8 4.7 Net cost of debt -169.8 -197.7 27.9 Change in the fair value of financial instruments -15.1 -12.1 -3.0 Share in earnings for equity method investees 74.4 89.5 -15.2 Pre-tax current income 1,717.0 1,702.6 14.4 Corporate income tax -219.2 -225.6 6.4 Net income 1,497.8 1,476.9 20.8 Non-controlling interests -269.2 -285.7 16.5 NET INCOME (GROUP SHARE) 1,228.6 1,191.2 37.4 Gross rental income for the year came to €1,236.0 million, an increase The net cost of debt amounted to €169.8 million. Restated for of €22.0 million thanks to a solid like-for-like rental growth and despite non-cash or non-recurring elements (Corio’s debt mark-to-market a €17 million loss due to disposals. For further explanations, please amortization and financial instruments unwinding costs), net financial refer to the “Business overview” and “Business activity by region” charges declined by €25.9 million, mostly due to further reductions sections of this document. in the cost of debt (1.8% vs. 2.1% a year ago). For more information Management and other income, mainly composed of property and on the debt situation, please refer to the “Financial policy” section of facility management fees, including third-party management fees and this document. development fees totaled €85.6 million in line with 2016. The share of earnings for equity investees reached €74.4 million, Payroll and other general expenses continued to decrease, to compared to €89.5 million in 2016 due to disposals in Scandinavia €124.9 million (down €6.5 million). This cost reduction reflects further and negative rent evolution in Akmerkez (Istanbul, Turkey). synergies after the Corio acquisition and the Group’s constant focus Corporate income tax for the period was €219.2 million: on streamlining the organization in all the countries it operates. > tax payable was €18.3 million; EBITDA for 2017 was €1,012.2 million, up 2.2%. > deferred tax increased by €201 million, due to the uplift in the fair Net proceeds from the sale of assets reached €6.8 million. Over 2017, market value of the Group’s real estate assets. the Group disposed of assets for a total consideration of €263.4 million. On a Total-Share basis, consolidated net income was €1,497.8 million. For more information on disposals completed throughout the year, The minority share of net income (non-controlling interests) for the please refer to the “Disposals completed since January 1, 2017” section period was €269.2 million, compared to €285.7 million last year, as of this document. a result of lower net income from Steen & Strøm (lower increase of Fair value of investment properties showed a positive change of investment properties’ value compared to last year). As such, net €825.9 million, highlighting a further like-for-like increase in the income (Group share) reached €1,228.6 million, up 3.1%. portfolio valuation (please refer to the “Property portfolio valuation” section of this document). KLÉPIERRE 2017 REGISTRATION DOCUMENT 53
 Registration Document 2017 Page 54 Page 56