.png)
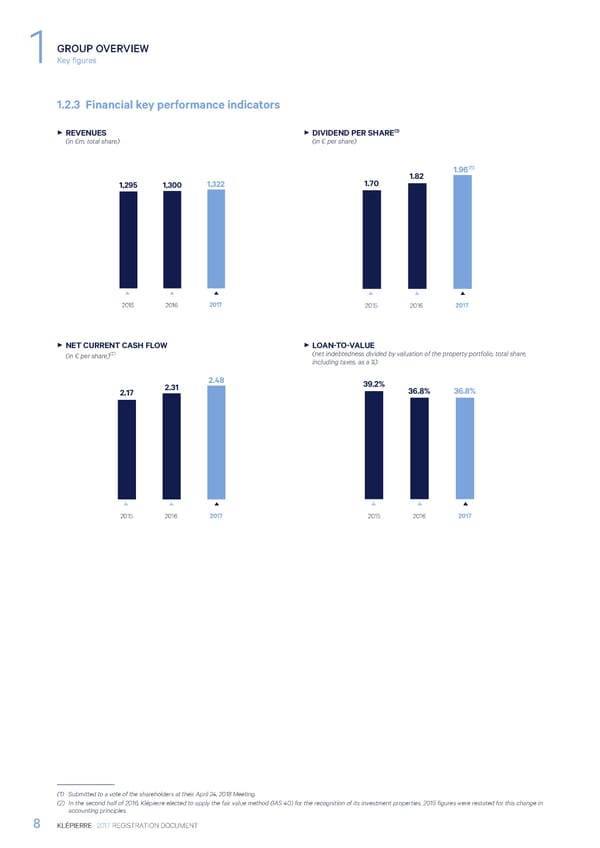
GROUP OVERVIEW 1 Key figures 1.2.3 Financial key performance indicators (1) 3 REVENUES 3 DIVIDEND PER SHARE (in €m, total share) (in € per share) 1.96 (1) 1.70 1.82 1,295 1,300 1,3221,322 2015 2016 2017 2015 2016 2017 3 NET CURRENT CASH FLOW 3 LOAN-TO-VALUE (in € per share)(2) (net indebtedness divided by valuation of the property portfolio, total share, including taxes, as a %) 2.31 2.48 39.2% 2.17 36.8% 36.8% 2015 2016 2017 2015 2016 2017 (1) Submitted to a vote of the shareholders at their April 24, 2018 Meeting. (2) In the second half of 2016, Klépierre elected to apply the fair value method (IAS 40) for the recognition of its investment properties. 2015 figures were restated for this change in accounting principles. 8 KLÉPIERRE 2017 REGISTRATION DOCUMENT
 Registration Document 2017 Page 9 Page 11