.png)
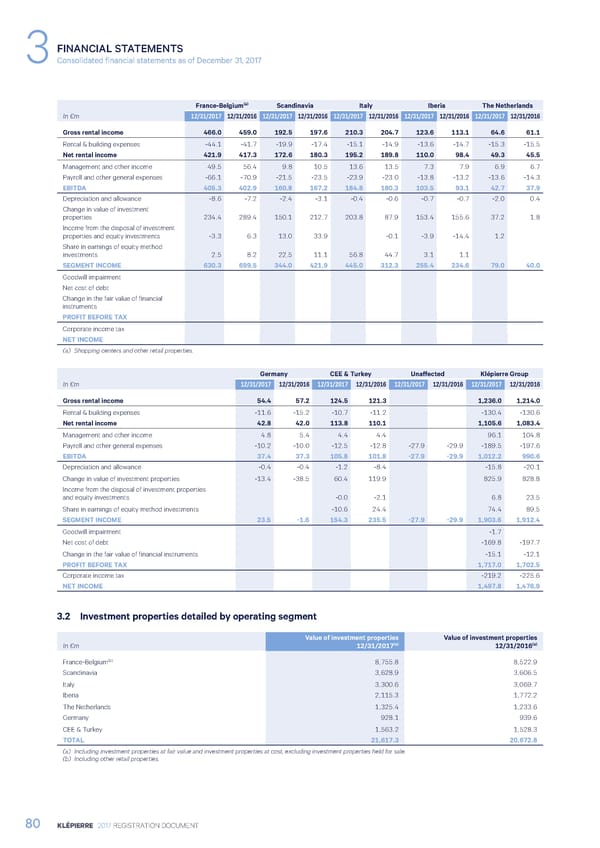
FINANCIAL STATEMENTS 3Consolidated financial statements as of December 31, 2017 France-Belgium(a) Scandinavia Italy Iberia The Netherlands In €m 12/31/2017 12/31/2016 12/31/2017 12/31/2016 12/31/2017 12/31/2016 12/31/2017 12/31/2016 12/31/2017 12/31/2016 Gross rental income 466.0 459.0 192.5 197.6 210.3 204.7 123.6 113.1 64.6 61.1 Rental & building expenses -44.1 -41.7 -19.9 -17.4 -15.1 -14.9 -13.6 -14.7 -15.3 -15.5 Net rental income 421.9 417.3 172.6 180.3 195.2 189.8 110.0 98.4 49.3 45.5 Management and other income 49.5 56.4 9.8 10.5 13.6 13.5 7.3 7.9 6.9 6.7 Payroll and other general expenses -66.1 -70.9 -21.5 -23.5 -23.9 -23.0 -13.8 -13.2 -13.6 -14.3 EBITDA 405.3 402.9 160.8 167.2 184.8 180.3 103.5 93.1 42.7 37.9 Depreciation and allowance -8.6 -7.2 -2.4 -3.1 -0.4 -0.6 -0.7 -0.7 -2.0 0.4 Change in value of investment properties 234.4 289.4 150.1 212.7 203.8 87.9 153.4 155.6 37.2 1.8 Income from the disposal of investment properties and equity investments -3.3 6.3 13.0 33.9 -0.1 -3.9 -14.4 1.2 Share in earnings of equity method investments 2.5 8.2 22.5 11.1 56.8 44.7 3.1 1.1 SEGMENT INCOME 630.3 699.5 344.0 421.9 445.0 312.3 255.4 234.6 79.0 40.0 Goodwill impairment Net cost of debt Change in the fair value of financial instruments PROFIT BEFORE TAX Corporate income tax NET INCOME (a) Shopping centers and other retail properties. Germany CEE & Turkey Unaffected Klépierre Group In €m 12/31/2017 12/31/2016 12/31/2017 12/31/2016 12/31/2017 12/31/2016 12/31/2017 12/31/2016 Gross rental income 54.4 57.2 124.5 121.3 1,236.0 1,214.0 Rental & building expenses -11.6 -15.2 -10.7 -11.2 -130.4 -130.6 Net rental income 42.8 42.0 113.8 110.1 1,105.6 1,083.4 Management and other income 4.8 5.4 4.4 4.4 96.1 104.8 Payroll and other general expenses -10.2 -10.0 -12.5 -12.8 -27.9 -29.9 -189.5 -197.6 EBITDA 37.4 37.3 105.8 101.8 -27.9 -29.9 1,012.2 990.6 Depreciation and allowance -0.4 -0.4 -1.2 -8.4 -15.8 -20.1 Change in value of investment properties -13.4 -38.5 60.4 119.9 825.9 828.8 Income from the disposal of investment properties and equity investments -0.0 -2.1 6.8 23.5 Share in earnings of equity method investments -10.6 24.4 74.4 89.5 SEGMENT INCOME 23.5 -1.6 154.3 235.5 -27.9 -29.9 1,903.6 1,912.4 Goodwill impairment -1.7 Net cost of debt -169.8 -197.7 Change in the fair value of financial instruments -15.1 -12.1 PROFIT BEFORE TAX 1,717.0 1,702.5 Corporate income tax -219.2 -225.6 NET INCOME 1,497.8 1,476.9 3.2 Investment properties detailed by operating segment Value of investment properties Value of investment properties (a) (a) In €m 12/31/2017 12/31/2016 (b) France-Belgium 8,755.8 8,522.9 Scandinavia 3,628.9 3,606.5 Italy 3,300.6 3,069.7 Iberia 2,115.3 1,772.2 The Netherlands 1,325.4 1,233.6 Germany 928.1 939.6 CEE & Turkey 1,563.2 1,528.3 TOTAL 21,617.3 20,672.8 (a) Including investment properties at fair value and investment properties at cost, excluding investment properties held for sale. (b) Including other retail properties. 80 KLÉPIERRE 2017 REGISTRATION DOCUMENT
 Registration Document 2017 Page 81 Page 83