.png)
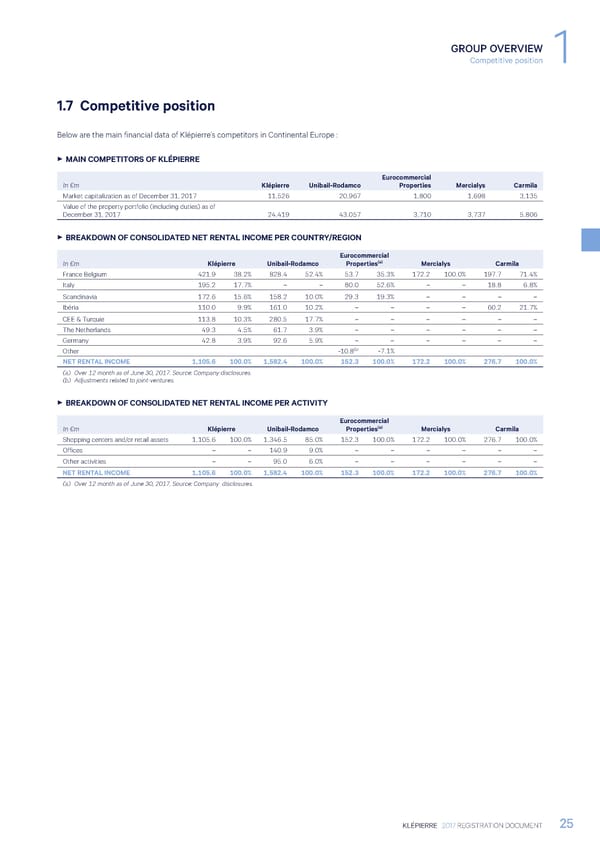
GROUP OVERVIEW Competitive position 1 1.7 Competitive position Below are the main financial data of Klépierre’s competitors in Continental Europe : 3 MAIN COMPETITORS OF KLÉPIERRE Eurocommercial In €m Klépierre Unibail-Rodamco Properties Mercialys Carmila Market capitalization as of December 31, 2017 11,526 20,967 1,800 1,698 3,135 Value of the property portfolio (including duties) as of December 31, 2017 24,419 43,057 3,710 3,737 5,806 3 BREAKDOWN OF CONSOLIDATED NET RENTAL INCOME PER COUNTRY/REGION Eurocommercial In €m Klépierre Unibail-Rodamco Properties(a) Mercialys Carmila France Belgium 421.9 38.2% 828.4 52.4% 53.7 35.3% 172.2 100.0% 197.7 71.4% Italy 195.2 17.7% – – 80.0 52.6% – – 18.8 6.8% Scandinavia 172.6 15.6% 158.2 10.0% 29.3 19.3% – – – – Ibéria 110.0 9.9% 161.0 10.2% – – – – 60.2 21.7% CEE & Turquie 113.8 10.3% 280.5 17.7% – – – – – – The Netherlands 49.3 4.5% 61.7 3.9% – – – – – – Germany 42.8 3.9% 92.6 5.9% – – – – – – Other -10.8(b) -7.1% NET RENTAL INCOME 1,105.6 100.0% 1,582.4 100.0% 152.3 100.0% 172.2 100.0% 276.7 100.0% (a) Over 12 month as of June 30, 2017. Source: Company disclosures. (b) Adjustments related to joint-ventures. 3 BREAKDOWN OF CONSOLIDATED NET RENTAL INCOME PER ACTIVITY Eurocommercial In €m Klépierre Unibail-Rodamco Properties(a) Mercialys Carmila Shopping centers and/or retail assets 1,105.6 100.0% 1,346.5 85.0% 152.3 100.0% 172.2 100.0% 276.7 100.0% Offices – – 140.9 9.0% – – – – – – Other activities – – 95.0 6.0% – – – – – – NET RENTAL INCOME 1,105.6 100.0% 1,582.4 100.0% 152.3 100.0% 172.2 100.0% 276.7 100.0% (a) Over 12 month as of June 30, 2017. Source: Company disclosures. KLÉPIERRE 2017 REGISTRATION DOCUMENT 25
 Registration Document 2017 Page 26 Page 28