.png)
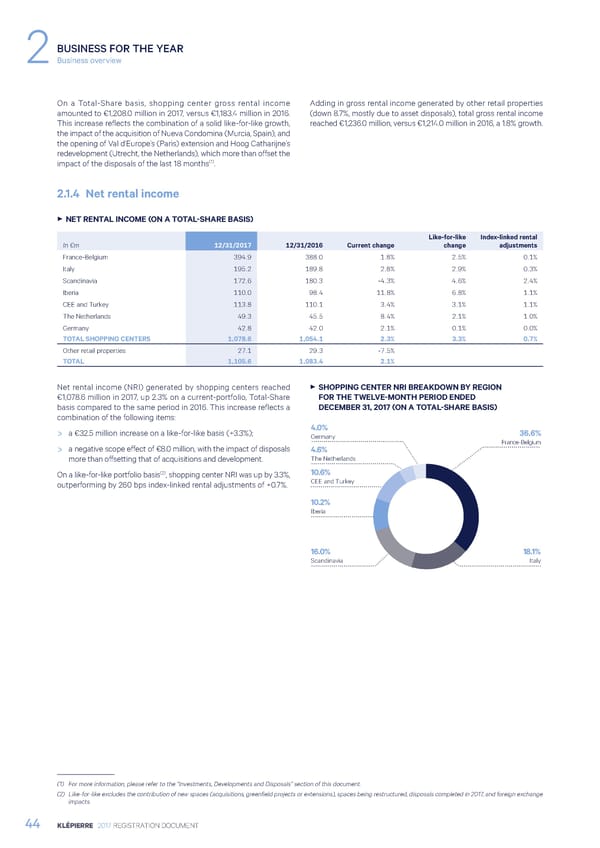
BUSINESS FOR THE YEAR 2Business overview On a Total-Share basis, shopping center gross rental income Adding in gross rental income generated by other retail properties amounted to €1,208.0 million in 2017, versus €1,183.4 million in 2016. (down 8.7%, mostly due to asset disposals), total gross rental income This increase reflects the combination of a solid like-for-like growth, reached €1,236.0 million, versus €1,214.0 million in 2016, a 1.8% growth. the impact of the acquisition of Nueva Condomina (Murcia, Spain), and the opening of Val d’Europe’s (Paris) extension and Hoog Catharijne’s redevelopment (Utrecht, the Netherlands), which more than offset the (1) impact of the disposals of the last 18 months . 2.1.4 Net rental income 3 NET RENTAL INCOME (ON A TOTAL-SHARE BASIS) Like-for-like Index-linked rental In €m 12/31/2017 12/31/2016 Current change change adjustments France-Belgium 394.9 388.0 1.8% 2.5% 0.1% Italy 195.2 189.8 2.8% 2.9% 0.3% Scandinavia 172.6 180.3 -4.3% 4.6% 2.4% Iberia 110.0 98.4 11.8% 6.8% 1.1% CEE and Turkey 113.8 110.1 3.4% 3.1% 1.1% The Netherlands 49.3 45.5 8.4% 2.1% 1.0% Germany 42.8 42.0 2.1% 0.1% 0.0% TOTAL SHOPPING CENTERS 1,078.6 1,054.1 2.3% 3.3% 0.7% Other retail properties 27.1 29.3 -7.5% TOTAL 1,105.6 1,083.4 2.1% Net rental income (NRI) generated by shopping centers reached 3 SHOPPING CENTER NRI BREAKDOWN BY REGION €1,078.6 million in 2017, up 2.3% on a current-portfolio, Total-Share FOR THE TWELVE-MONTH PERIOD ENDED basis compared to the same period in 2016. This increase reflects a DECEMBER 31, 2017 (ON A TOTAL-SHARE BASIS) combination of the following items: > a €32.5 million increase on a like-for-like basis (+3.3%); 4.0% 36.6% Germany France-Belgium > a negative scope effect of €8.0 million, with the impact of disposals 4.6% more than offsetting that of acquisitions and development. The Netherlands (2) 10.6% On a like-for-like portfolio basis , shopping center NRI was up by 3.3%, outperforming by 260 bps index-linked rental adjustments of +0.7%. CEE and Turkey 10.2% Iberia 16.0% 18.1% Scandinavia Italy (1) For more information, please refer to the “Investments, Developments and Disposals” section of this document. (2) Like-for-like excludes the contribution of new spaces (acquisitions, greenfield projects or extensions), spaces being restructured, disposals completed in 2017, and foreign exchange impacts. 44 KLÉPIERRE 2017 REGISTRATION DOCUMENT
 Registration Document 2017 Page 45 Page 47