.png)
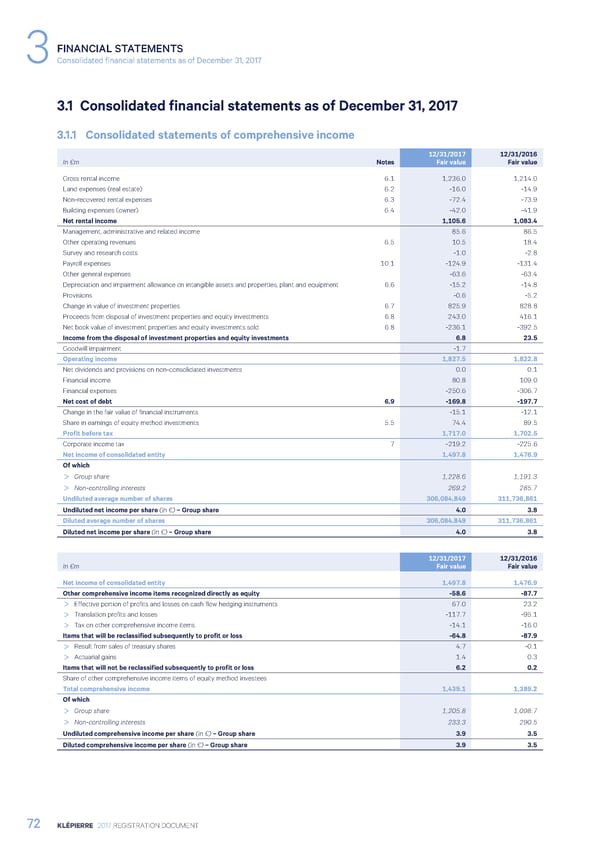
FINANCIAL STATEMENTS 3Consolidated financial statements as of December 31, 2017 3.1 Consolidated financial statements as of December 31, 2017 3.1.1 Consolidated statements of comprehensive income 12/31/2017 12/31/2016 In €m Notes Fair value Fair value Gross rental income 6.1 1,236.0 1,214.0 Land expenses (real estate) 6.2 -16.0 -14.9 Non-recovered rental expenses 6.3 -72.4 -73.9 Building expenses (owner) 6.4 -42.0 -41.9 Net rental income 1,105.6 1,083.4 Management, administrative and related income 85.6 86.5 Other operating revenues 6.5 10.5 18.4 Survey and research costs -1.0 -2.8 Payroll expenses 10.1 -124.9 -131.4 Other general expenses -63.6 -63.4 Depreciation and impairment allowance on intangible assets and properties, plant and equipment 6.6 -15.2 -14.8 Provisions -0.6 -5.2 Change in value of investment properties 6.7 825.9 828.8 Proceeds from disposal of investment properties and equity investments 6.8 243.0 416.1 Net book value of investment properties and equity investments sold 6.8 -236.1 -392.5 Income from the disposal of investment properties and equity investments 6.8 23.5 Goodwill impairment -1.7 Operating income 1,827.5 1,822.8 Net dividends and provisions on non-consolidated investments 0.0 0.1 Financial income 80.8 109.0 Financial expenses -250.6 -306.7 Net cost of debt 6.9 -169.8 -197.7 Change in the fair value of financial instruments -15.1 -12.1 Share in earnings of equity method investments 5.5 74.4 89.5 Profit before tax 1,717.0 1,702.5 Corporate income tax 7 -219.2 -225.6 Net income of consolidated entity 1,497.8 1,476.9 Of which > Group share 1,228.6 1,191.3 > Non-controlling interests 269.2 285.7 Undiluted average number of shares 306,084,849 311,736,861 Undiluted net income per share (in €) – Group share 4.0 3.8 Diluted average number of shares 306,084,849 311,736,861 Diluted net income per share (in €) – Group share 4.0 3.8 12/31/2017 12/31/2016 In €m Fair value Fair value Net income of consolidated entity 1,497.8 1,476.9 Other comprehensive income items recognized directly as equity -58.6 -87.7 > Effective portion of profits and losses on cash flow hedging instruments 67.0 23.2 > Translation profits and losses -117.7 -95.1 > Tax on other comprehensive income items -14.1 -16.0 Items that will be reclassified subsequently to profit or loss -64.8 -87.9 > Result from sales of treasury shares 4.7 -0.1 > Actuarial gains 1.4 0.3 Items that will not be reclassified subsequently to profit or loss 6.2 0.2 Share of other comprehensive income items of equity method investees Total comprehensive income 1,439.1 1,389.2 Of which > Group share 1,205.8 1,098.7 > Non-controlling interests 233.3 290.5 Undiluted comprehensive income per share (in €) – Group share 3.9 3.5 Diluted comprehensive income per share (in €) – Group share 3.9 3.5 72 KLÉPIERRE 2017 REGISTRATION DOCUMENT
 Registration Document 2017 Page 73 Page 75